Motivation
Look at all the impressive skills I have acquired in the MDAG 2025 workshop.
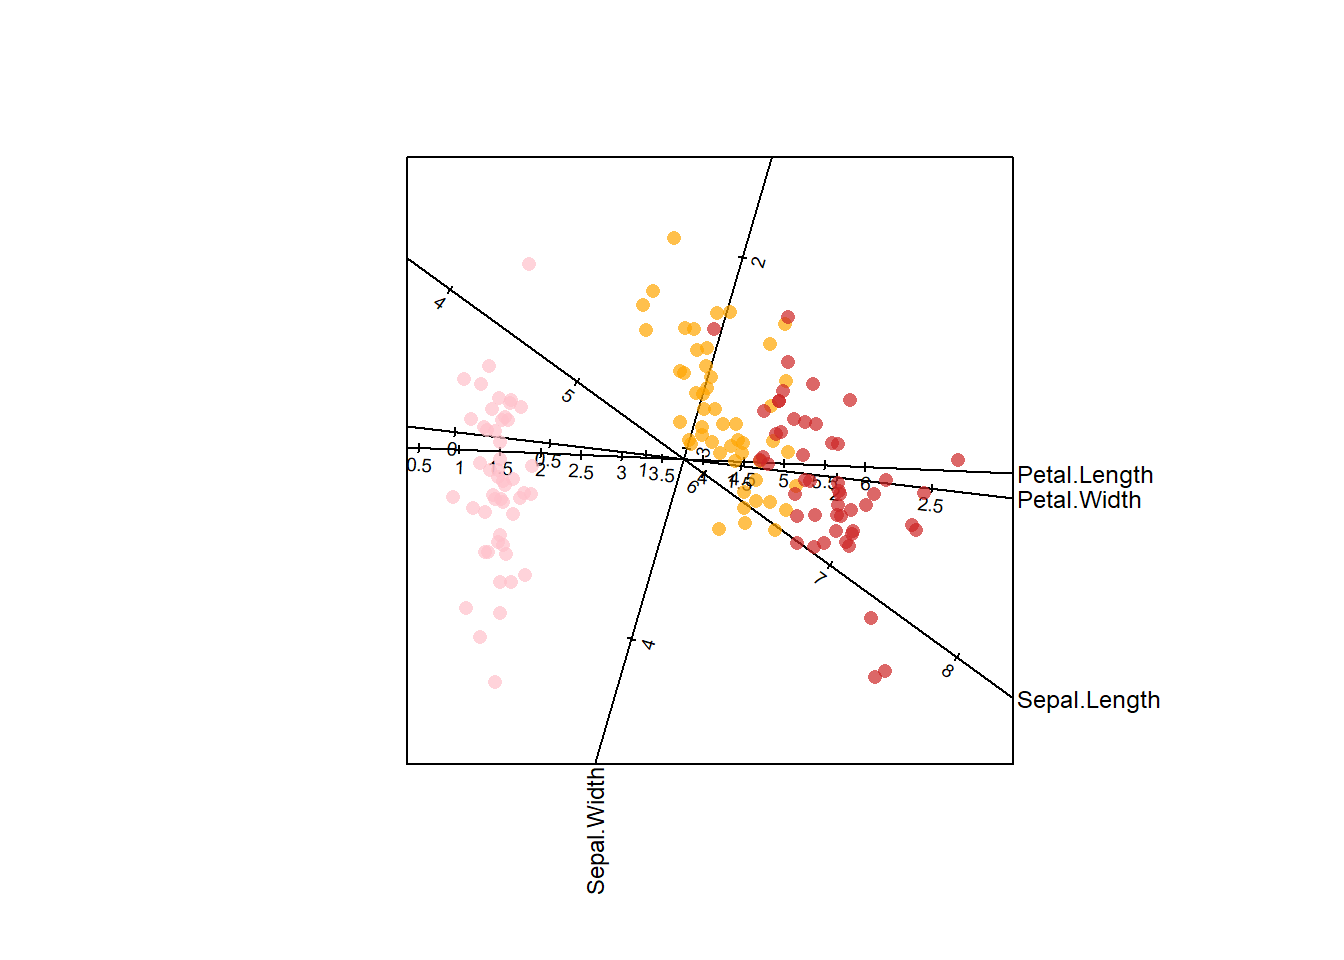
About the example: Illustrating the classic iris data set with biplotEZ
Welcome to biplotEZ!
This package is used to construct biplots
Run ?biplot or vignette() for more information
Attaching package: 'biplotEZ'
The following object is masked from 'package:stats':

    biplot
bp <- biplot(iris,scale=TRUE) |>
  PCA(group.aes=iris$Species) |>
  axes(col="black") |>
  samples(col=c("pink","orange","firebrick3"),opacity = 0.7) |>
  plot()
Next
Stay tuned for some new blog posts.